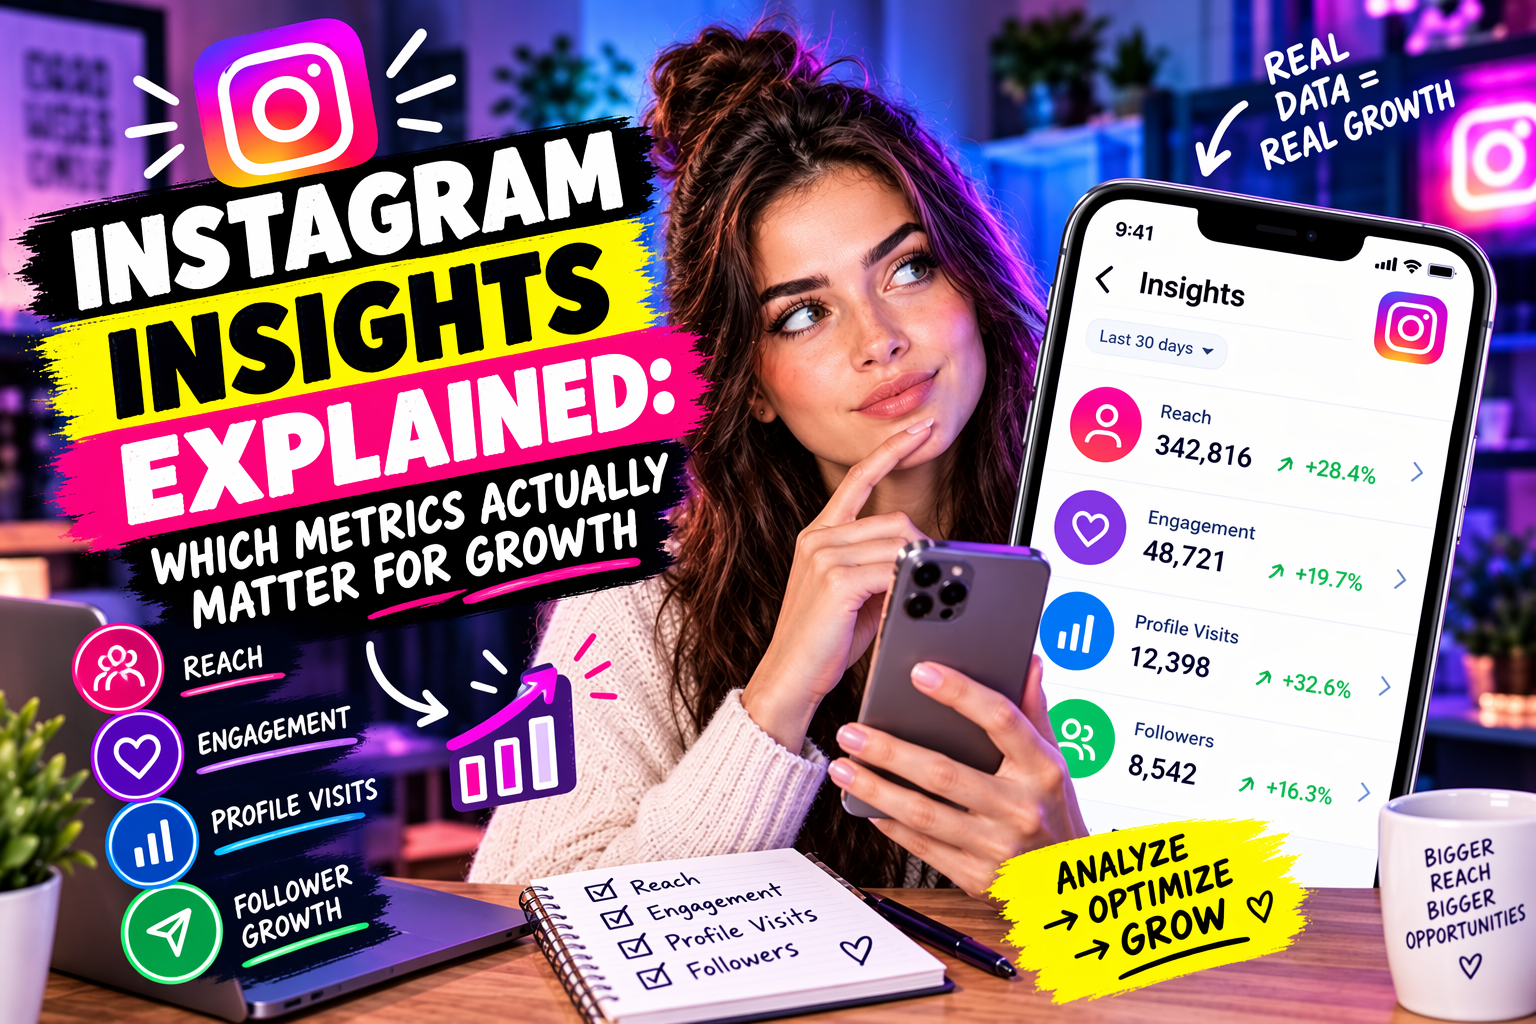
Instagram Insights gives you access to dozens of metrics. Most creators either ignore them entirely, or get lost tracking numbers that feel important but don't actually connect to growth. This guide cuts through the noise: which metrics are genuinely predictive of growth, which are vanity metrics you can safely deprioritize, and how to read the numbers that matter in a way that leads to better decisions.
The Metrics That Actually Drive Growth
1. Non-follower reach (reach from non-followers).
This is the single most important growth indicator in Insights. It tells you how many accounts that don't follow you saw your content. A high non-follower reach means Instagram's algorithm is distributing your content beyond your existing audience — the precondition for organic growth. If this number is low relative to your total reach, your content is essentially staying within your existing bubble.
Where to find it: post Insights → Reach → breakdown by 'Followers' and 'Non-followers'. Benchmark: on a healthy growing account, non-follower reach should represent at least 40-60% of total reach on your best posts.
2. Saves.
Saves are the strongest engagement signal Instagram's algorithm registers. When someone saves a post, it signals that the content has lasting value — worth returning to, not just worth scrolling past. The algorithm interprets high save rates as a strong quality signal and extends distribution accordingly.
What a good save rate looks like: 2-5% of reach is solid, 5%+ is excellent. A post with 1,000 reach and 50 saves is performing far better algorithmically than a post with 1,000 reach and 200 likes but 5 saves.
3. Profile visits from a specific post.
This metric tells you how many people were curious enough about your account to visit your profile after seeing a post. High profile visits mean the content made people want to know more — the step right before following. Track this alongside follower gains: if a post generates lots of profile visits but few follows, your bio or grid may be the conversion problem, not the content.
4. Accounts reached (unique accounts).
Total impressions (how many times content was displayed) is less useful than accounts reached (how many distinct people saw it). Reach is the more meaningful growth metric because growth comes from reaching new people, not from the same person seeing your content five times.
Secondary Metrics Worth Tracking
Comments — but read them, don't just count them.
Comment count matters less than comment quality. Ten genuine comments discussing the topic signal more algorithmic value than fifty 'great post!' comments from engagement pods. Instagram has become better at distinguishing comment quality, and so should you when interpreting your data.
Story views and completion rate.
Story completion rate (what percentage of viewers watched through to the end) tells you whether your Stories are holding attention. A completion rate above 70% is good. The 'exits' metric is equally important: if people are exiting on a specific frame, that frame is losing them.
Reel plays and average watch time.
For Reels, watch time is the key metric. Instagram prioritizes Reels that hold attention. The first 3 seconds are critical — if viewers are dropping off in the first three seconds, the hook isn't working. Average watch time above 50% of video length is a strong signal.
Metrics You Can Safely Deprioritize
Total impressions.
Impressions count every time content is displayed, including repeat views from the same person. A single account refreshing your profile ten times counts as ten impressions. This inflates the number without signaling growth. Reach (unique accounts) is the more honest metric.
Follower count as a daily metric.
Follower count is a lagging indicator — it reflects past performance, not current. Obsessing over daily follower changes creates noise. Track it weekly or monthly, and focus on the leading indicators (reach, saves, profile visits) that predict future follower changes.
Likes.
Likes are the most visible engagement signal but one of the weakest in terms of algorithmic weight. They're a low-effort action. They're still a positive signal, but if you're choosing between optimizing for saves vs. optimizing for likes, optimize for saves every time.
Website clicks.
Website clicks matter enormously if your goal is driving traffic — but as a growth metric they're irrelevant. You can have a high-growth account with zero website clicks and a stagnant account with many.
How to Read Insights for Actionable Decisions
The goal of reviewing Insights is not to collect data — it's to make better content decisions. A practical framework:
1. Every week, identify your top 3 posts by non-follower reach and your bottom 3. What's different between them? Topic, format, posting time, caption length?
2. Every week, identify your top 3 posts by saves. What made them worth saving? Was it a checklist, a comparison, an instructional format?
3. Monthly, look at your audience breakdown. Where are your followers from, what's the age/gender split, when are they most active? Use this to calibrate posting times.
4. Quarterly, compare your ER (total engagement / reach) trend. Is it going up, down, or flat? A downward ER trend with growing followers is a quality problem.
The Hidden Metric: Audience Quality
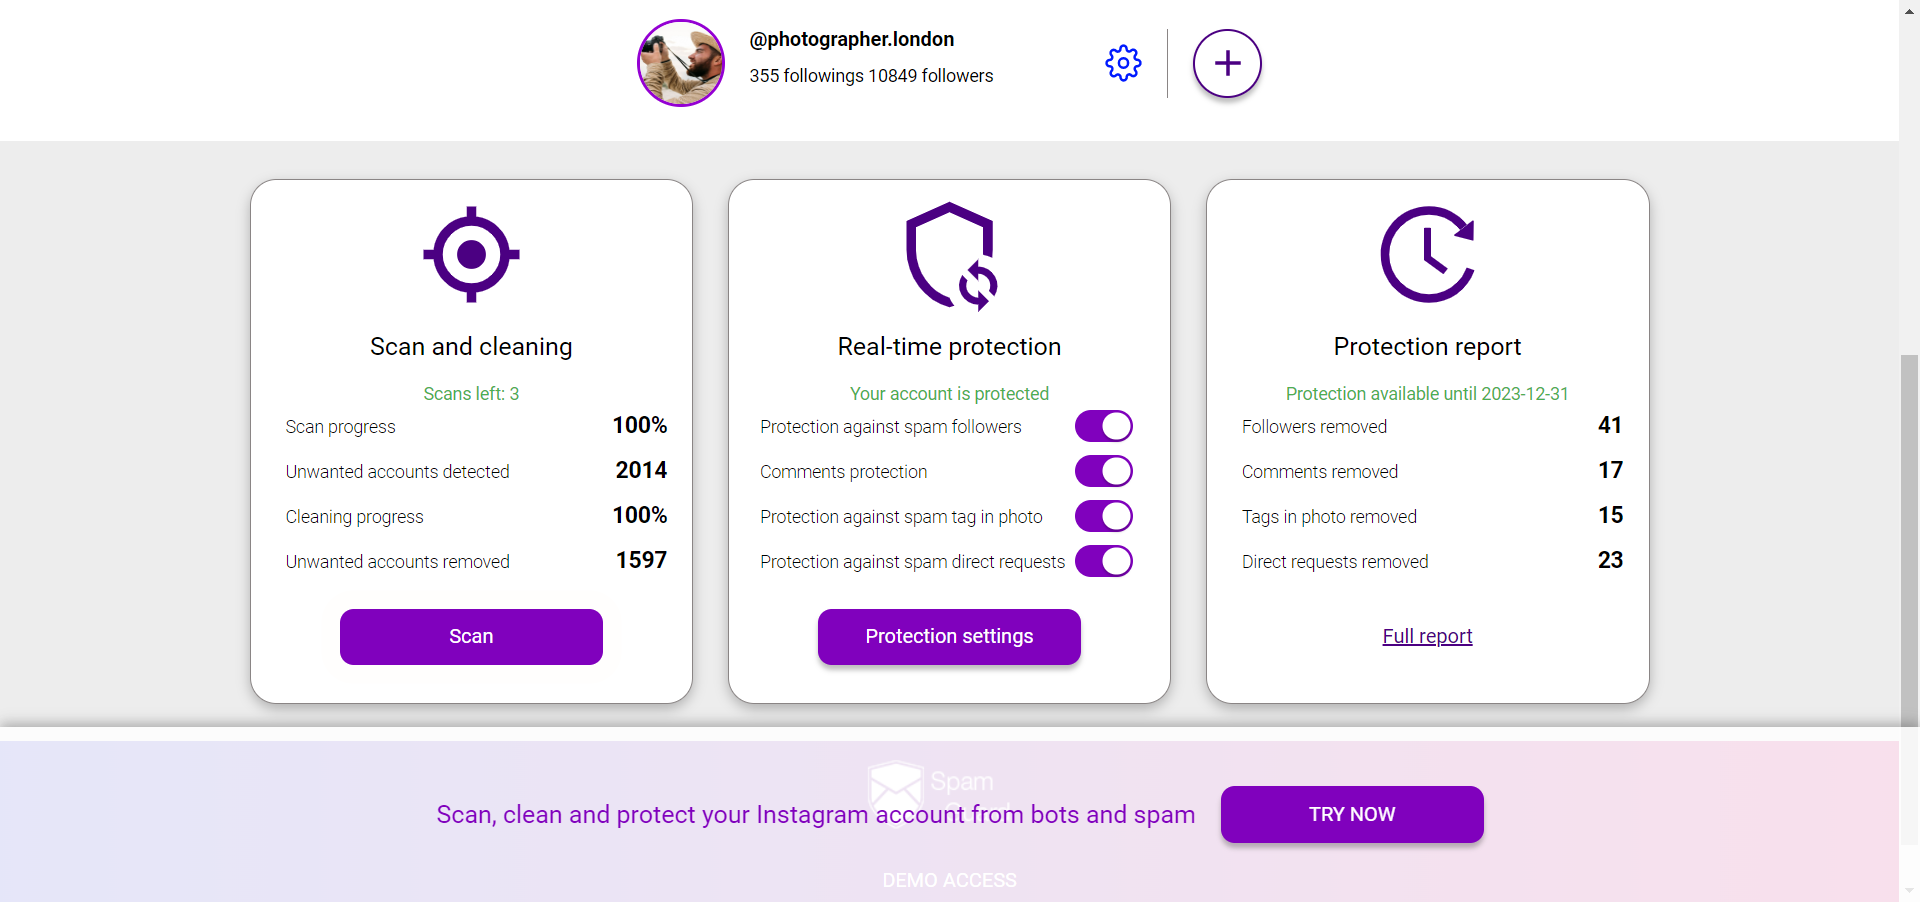
Insights doesn't show you something critical: what proportion of your followers are real, active accounts. Your ER, your save rate, your reach from followers — all of these are directly affected by how many bots and inactive accounts are in your audience. A heavily inflated audience mathematically suppresses your ER and makes Insights numbers look worse than they should. Running a periodic audience audit with SpamGuard gives you the actual baseline — what your metrics would look like with a clean audience — and removes the noise that distorts your readings.
Benchmarks by Account Size
• Under 1K followers: expect higher ER (6-10%) because your audience is more personal. Non-follower reach will be low — focus on hashtag performance.
• 1K-10K followers: ER of 3-6% is healthy. Non-follower reach should start contributing meaningfully. This is the range where saves and profile visits become the most valuable signals.
• 10K-100K followers: ER naturally decreases with scale (2-4% is normal). Non-follower reach becomes the dominant growth lever. Algorithm distribution matters more than manual engagement.
• 100K+: ER often drops to 1-3%. At this scale, absolute engagement numbers matter more than percentages. Reach from Explore and Reels recommendations becomes the primary growth channel.
For growing your account's reach through hashtag strategy and targeted following — tools with proper safety limits at Zengram.