Engagement rate is one of the most commonly cited Instagram metrics and one of the most commonly misunderstood. A 2% ER on a food account is weak; a 2% ER on a B2B SaaS account may be excellent. Without niche-specific benchmarks, the number is almost meaningless. Here's what current data shows across major categories.
Why Niche Matters More Than Account Size
ER benchmarks vary significantly by content category because different niches have fundamentally different audience behaviors. Finance content attracts followers who save and read carefully but rarely comment publicly. Fitness content generates high comment volume because people share progress and ask questions. Entertainment accounts get mass likes but low saves. Comparing a finance account's ER to a fitness account's ER produces a misleading conclusion.
Account size also affects ER independently of niche. Smaller accounts consistently outperform larger ones on percentage engagement because their audiences are more tightly self-selected and the creator often has personal relationships with followers. Both variables — niche and size — need to be held constant for a meaningful comparison.
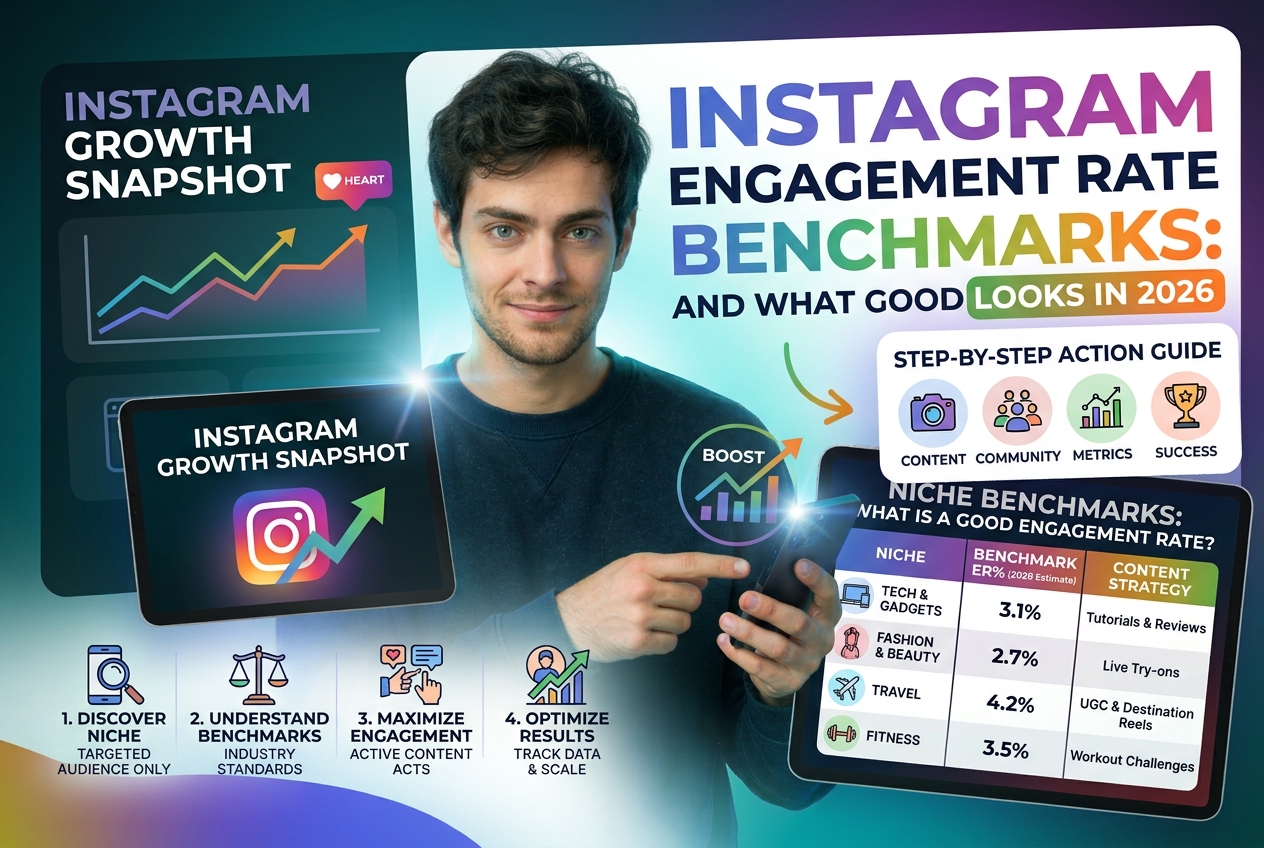
ER Benchmarks by Niche (2026 data, accounts under 100K followers)
Fitness and wellness: 4–8% — high comment volume as followers share progress, ask training questions, and motivate each other. Saves are high on workout plans and nutrition guides.
Food and recipes: 3.5–7% — strong save behavior on recipe content; comments are active when people try and report results. Visual content performs well on both likes and shares.
Fashion and beauty: 3–6% — high likes and shares; saves on outfit compositions and tutorials. Comment depth is lower than fitness but volume is high.
Travel: 2.5–5% — saves are very high on destination guides and packing lists; likes driven by aspirational imagery. Comments tend to be questions about specific places.
Marketing and business: 2–4.5% — save-heavy content performs best (frameworks, checklists, case studies). Comments are substantive but lower volume than lifestyle niches.
Finance and investing: 1.5–3.5% — audience is engaged but publicly reserved; saves are disproportionately high relative to visible engagement metrics. Low comment volume doesn't indicate low interest.
Parenting: 3–6% — high community engagement, high comment volume with personal sharing. Saves on practical advice content (sleep schedules, developmental milestones).
Technology and SaaS: 1.5–3% — professional audience that engages selectively. High saves on comparison content and how-tos; low comment volume.
The Hidden ER Problem: Fake Engagement
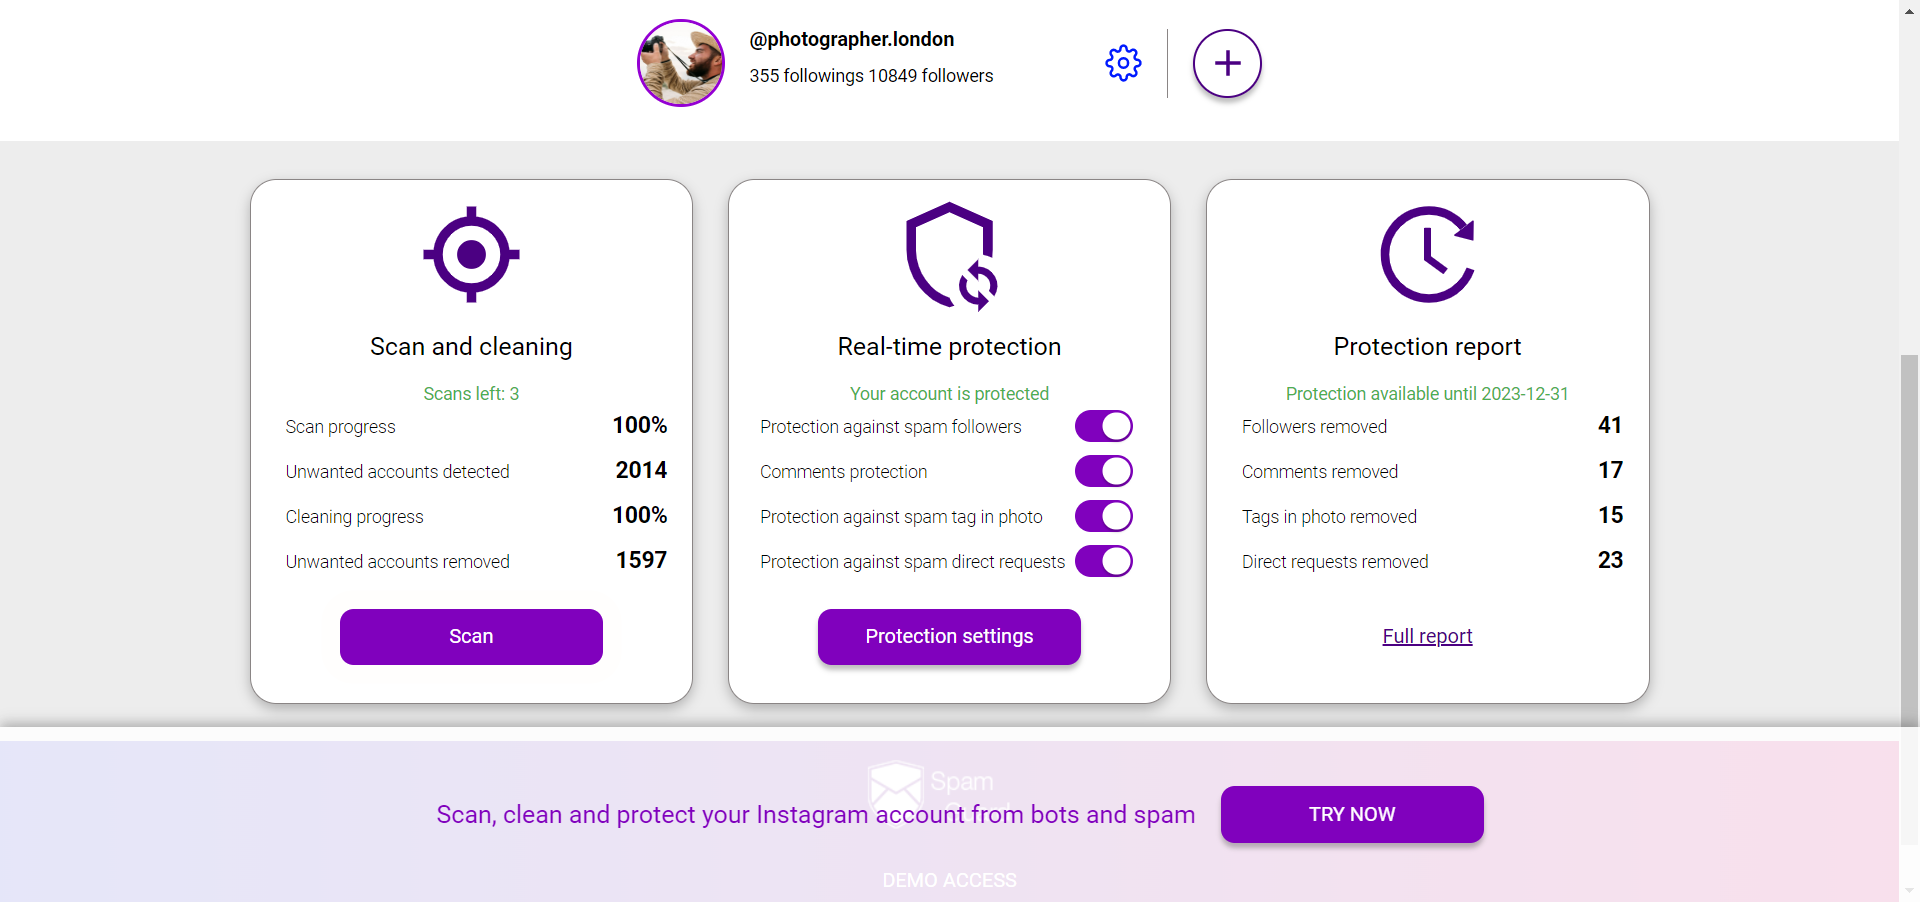
These benchmarks assume a real, active audience. An account with a significant portion of bot or inactive followers will show artificially depressed ER — not because the content is poor, but because the denominator (follower count) includes accounts that will never engage. A 3% ER with 30% bot followers is actually closer to 4.3% against the real audience.SpamGuard identifies the fake and inactive portion of an audience, allowing you to calculate an adjusted ER that reflects actual performance.
This matters for two reasons: accurate self-assessment (you may be performing better than your raw number suggests) and external evaluation (when auditing a potential partner or competitor, inflated follower counts distort ER comparisons).
Saves as a Supplementary Benchmark
As Instagram's algorithm has weighted saves more heavily in distribution decisions, saves-per-post have become an important parallel metric. A useful target: saves should be at least 0.5–1% of your follower count on strong performing posts. A 5,000-follower account getting 50+ saves on informational content is performing well by this measure.
Saves tend to be more stable across niches than likes and comments, making them a useful cross-niche comparison point.
What To Do If You're Below Benchmark
Audience quality is frequently the silent culprit. SpamGuard provides a full audit showing what percentage of your followers are bots, inactive, or mass-followers — the categories that drag your ER below what your content deserves.