Engagement rate is the most important metric for understanding whether your Instagram content actually connects with your audience. But benchmarks shift, algorithms evolve, and what was considered good in 2022 may be average or even poor today. Here is an updated guide for 2026.
What Engagement Rate Means and How to Calculate It
Engagement rate (ER) measures the percentage of your audience that actively interacts with your content. The standard formula:
ER = (Likes + Comments + Saves + Shares) / Followers × 100%
Some tools use only likes and comments; others include saves and shares (which Instagram's algorithm heavily weights). For the most accurate picture, use the full formula with all interaction types.
Instagram also offers Reach-based ER: (Total Interactions / Reach) × 100%. This measures how well your content performs among people who actually saw it, independent of follower count.
What Is a Good Engagement Rate in 2026
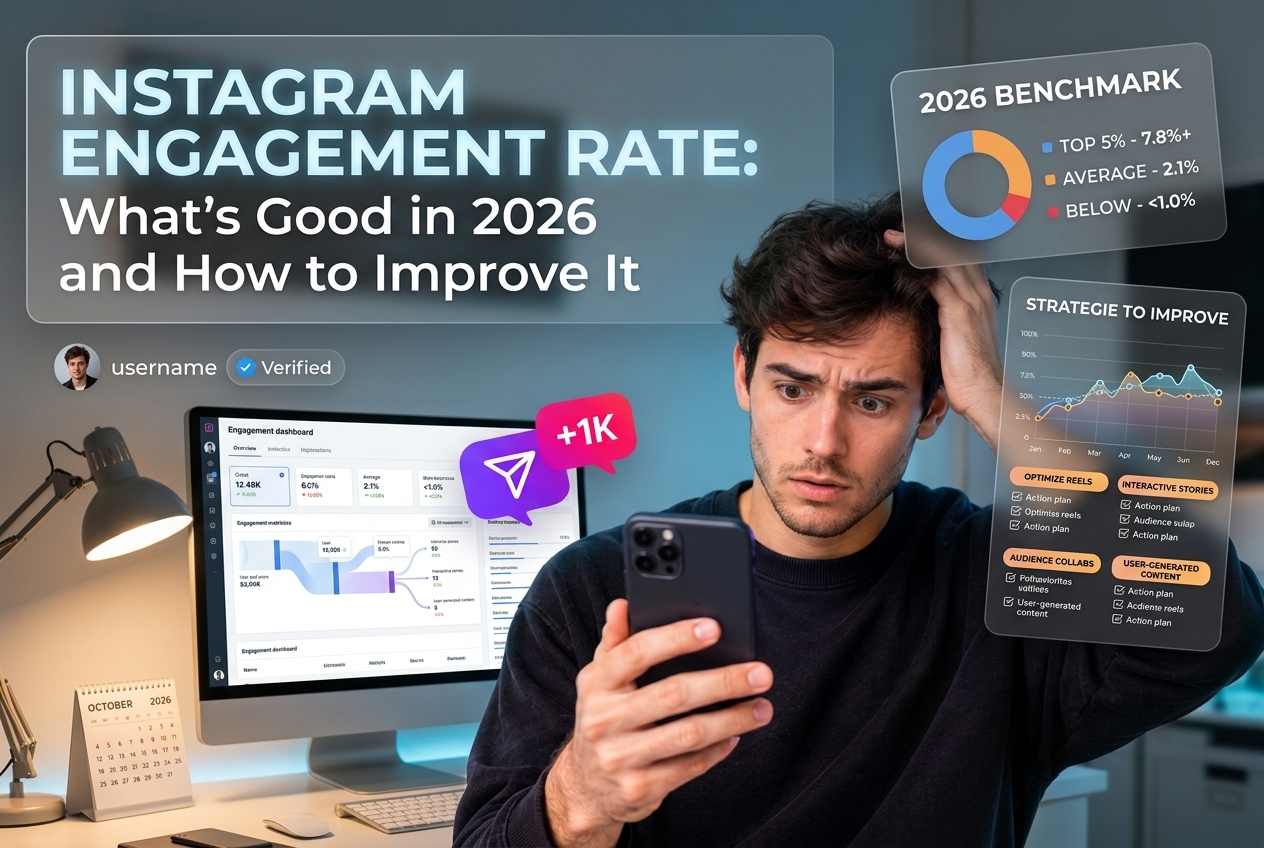
Benchmarks by account size (follower-based ER):
The inverse relationship between follower count and ER is well-established — larger accounts have more passive followers and lower average engagement percentages. Comparing a 2K account to a 500K account on raw ER is meaningless.
Why ER Benchmarks Have Shifted Since 2022
Several factors have changed the landscape:
The Hidden ER Killer: Ghost Followers and Bots
The most common reason for below-benchmark ER is not poor content — it is audience quality. Ghost followers (inactive accounts, bots, and mass-follow accounts) do not engage. They dilute the denominator of your ER calculation without contributing to the numerator.
A concrete example: an account with 10,000 followers, 2,000 of which are bots, has an effective audience of 8,000. If 320 real followers engage with a post, the true ER among real followers is 4% — but the reported ER based on total followers is 3.2%. That 0.8% difference puts you in a different benchmark tier.
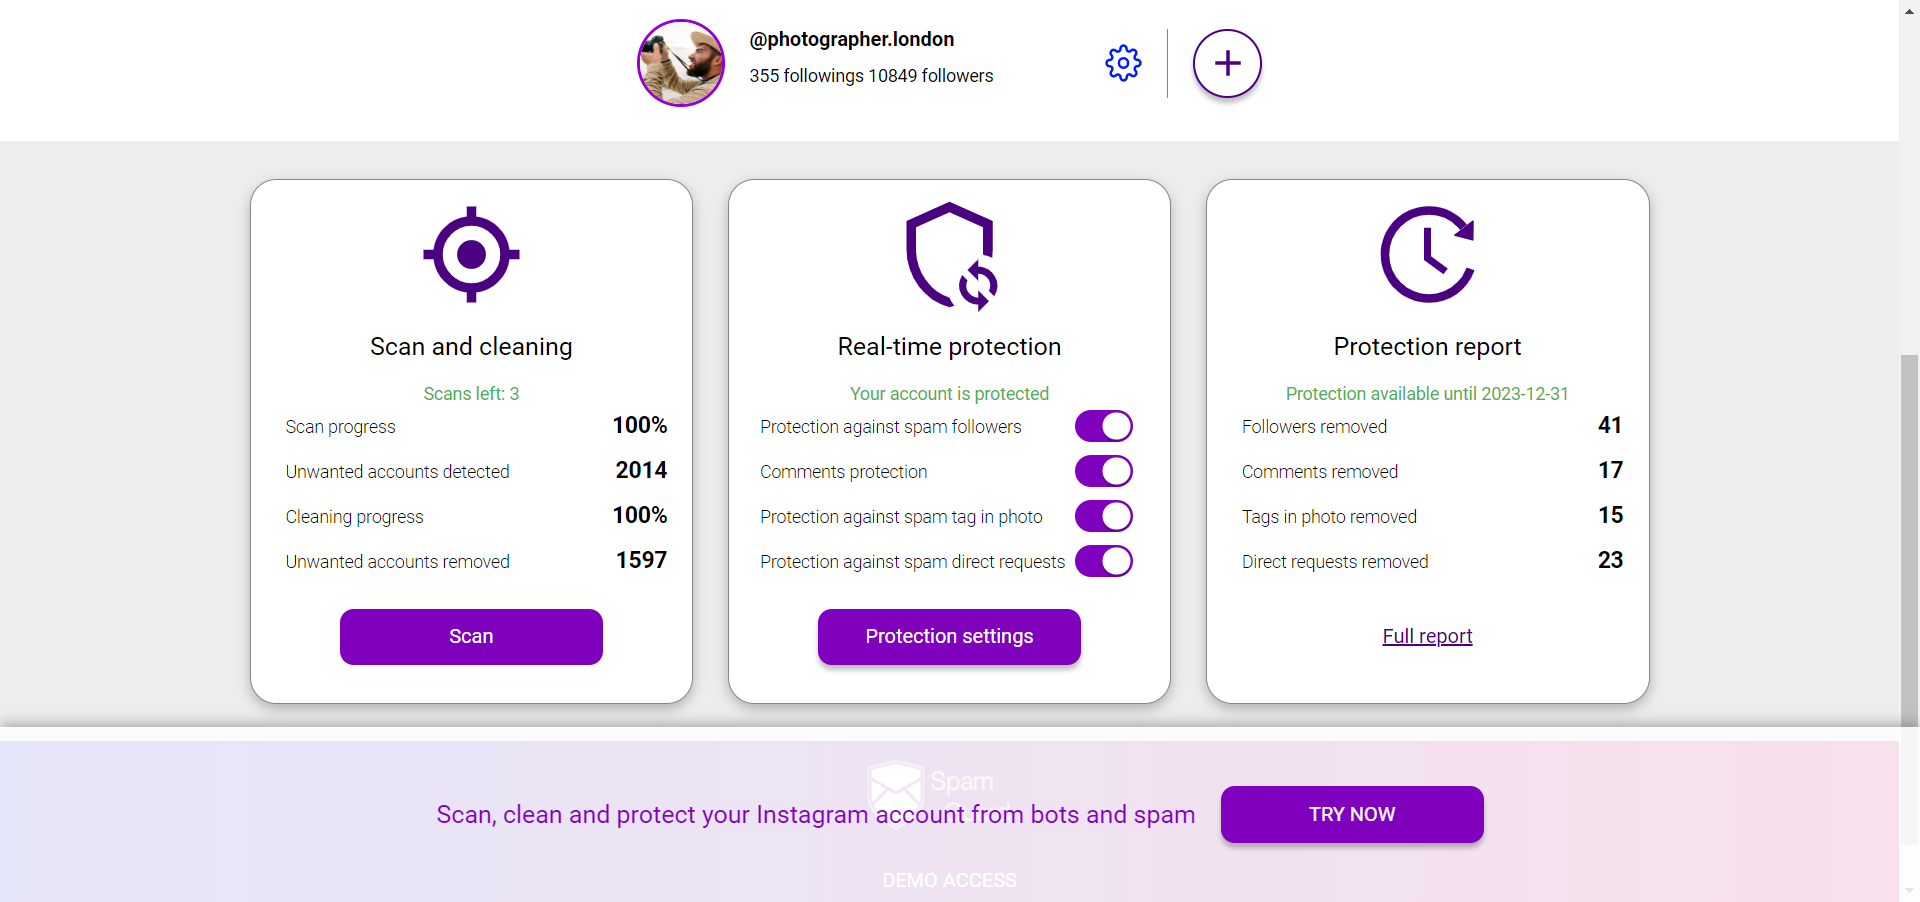
More importantly, the algorithm sees the low interaction rate across the full follower base and reduces your content's reach. Removing ghost followers consistently improves organic reach — often by 20-40% — because the algorithm reassesses your content quality against a cleaner audience. Check your audience quality with SpamGuard
Content Strategies That Improve ER in 2026
Optimize for saves:
Saved posts are heavily weighted by Instagram's algorithm. Content that people save: tutorials they will reference later, checklists and frameworks, inspirational content people want to revisit, data and statistics. Ask yourself before every post: would someone save this?
Prioritize Reels:
Reels consistently generate higher reach and engagement than static posts. Even accounts with strong static content should integrate at least 2-3 Reels per week.
Use strong calls to action:
Explicitly asking for engagement ("save this for later", "share your experience in comments") measurably increases interaction rates. This sounds obvious, but most posts do not include specific CTAs.
Post timing matters more than most think:
The first hour after posting is critical for algorithmic distribution. Posting when your audience is most active maximizes early engagement, which triggers wider reach. Check your Instagram Insights for peak hours.
Carousel posts drive saves:
Multi-image carousels are saved 2-3x more often than single images on average. They also get a second algorithmic push when a viewer swipes to the next image.
How to Audit Your Current ER Accurately
ER Is a Means, Not an End
High ER matters because it correlates with algorithm favor, which drives reach, which drives follower growth and business results. But the goal is not to optimize the number — it is to create content that genuinely connects with your audience, which produces high ER as a byproduct.
Accounts that chase ER through gimmicks (like/comment pods, empty engagement bait) often see short-term spikes and long-term audience quality deterioration.
Audit your Instagram audience quality to fix ER at the root — SpamGuard