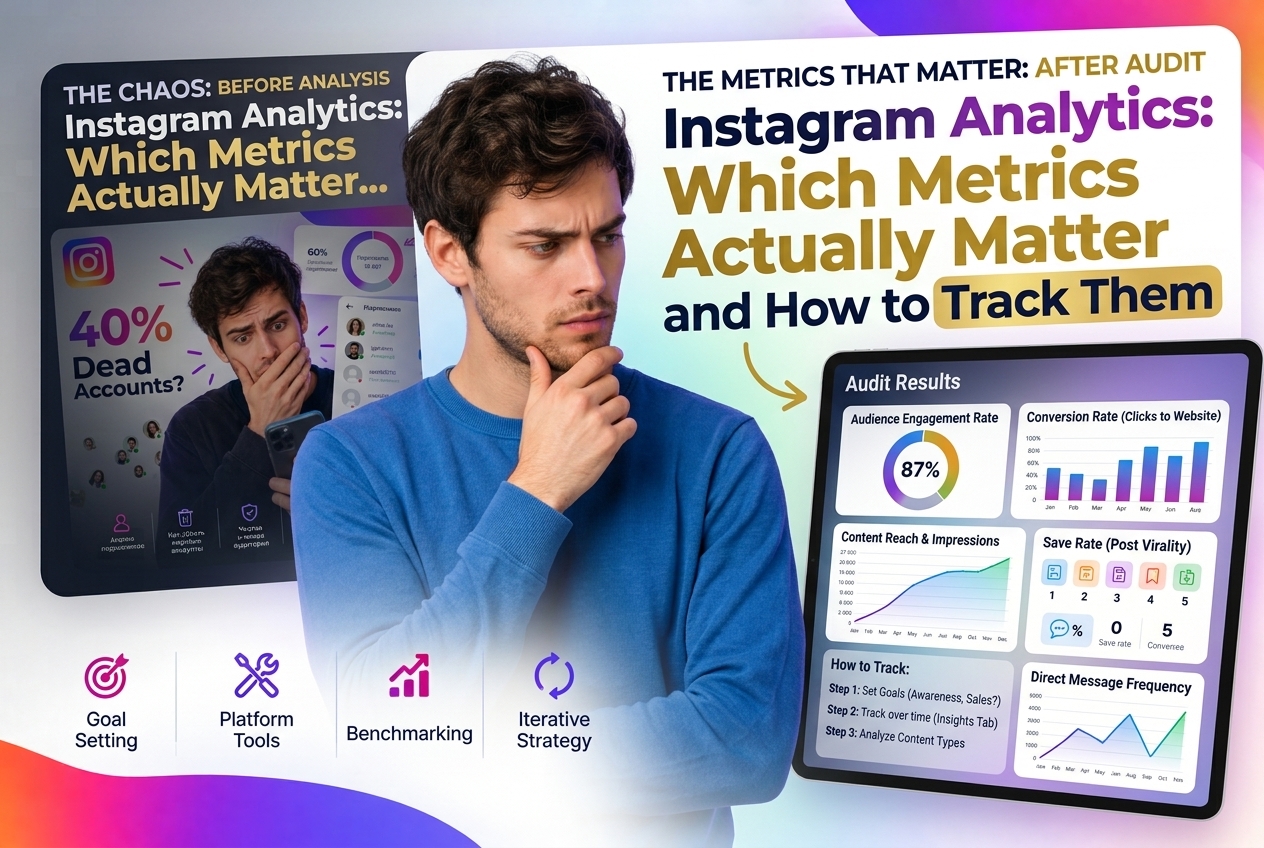
Instagram shows you dozens of numbers. Most of them are vanity metrics that feel meaningful but don't help you make better decisions. This guide covers the metrics that actually correlate with account growth, content performance, and audience quality — and explains how to track each one.
The Problem with Instagram's Native Analytics
Instagram Insights gives you follower count, reach, impressions, profile visits, and engagement rate. These are useful — but they're all output metrics. They tell you what happened, not why, and they don't tell you anything about the quality of your audience.
The metric Instagram doesn't show you: what percentage of your followers are real, active accounts. An account with 10,000 followers and 40% bots performs worse than an account with 6,000 clean followers. Yet Instagram's dashboard shows the larger number as the better-performing account.
Reach Rate: The Most Honest Engagement Signal
Reach rate = (unique accounts reached by a post) ÷ (total followers) × 100.
Why it matters: Instagram's algorithm distributes content to a fraction of your followers first. If that fraction engages, it distributes wider. Reach rate tells you how effectively your content is getting through the initial distribution filter.
Benchmarks by account size:
If your reach rate is significantly below these benchmarks, two likely causes: low engagement on recent posts (algorithm stopped distributing), or a high percentage of inactive followers diluting distribution.
Engagement Rate by Reach (ERR)
Standard engagement rate divides by follower count. This is misleading if you have a large number of inactive followers — it makes your engagement look lower than it is.
ERR = (likes + comments + saves + shares) ÷ reach × 100.
ERR tells you what percentage of people who actually saw the post engaged with it. This is a much cleaner signal of content quality because it removes the follower quality variable.
A healthy ERR for most niches: 3-8%. Above 10% is exceptional. Below 2% suggests the content isn't resonating with the audience that's seeing it.
Save Rate: The Hidden Quality Indicator
Saves are the most underrated metric in Instagram analytics. When someone saves a post, they're signaling that they want to return to it — high intent behavior.
Save rate = saves ÷ reach × 100.
Instagram's algorithm treats saves as a stronger signal than likes. A post with 100 saves and 200 likes will typically outperform a post with 500 likes and 10 saves in terms of long-term reach.
Track save rate by content type: educational posts (carousels, how-tos) typically outperform entertainment posts on saves. This data helps you understand what your audience finds genuinely valuable vs. what they enjoy in the moment.
Follower Quality Metrics
None of the above metrics tell you about the underlying quality of your audience. For that, you need external analysis.
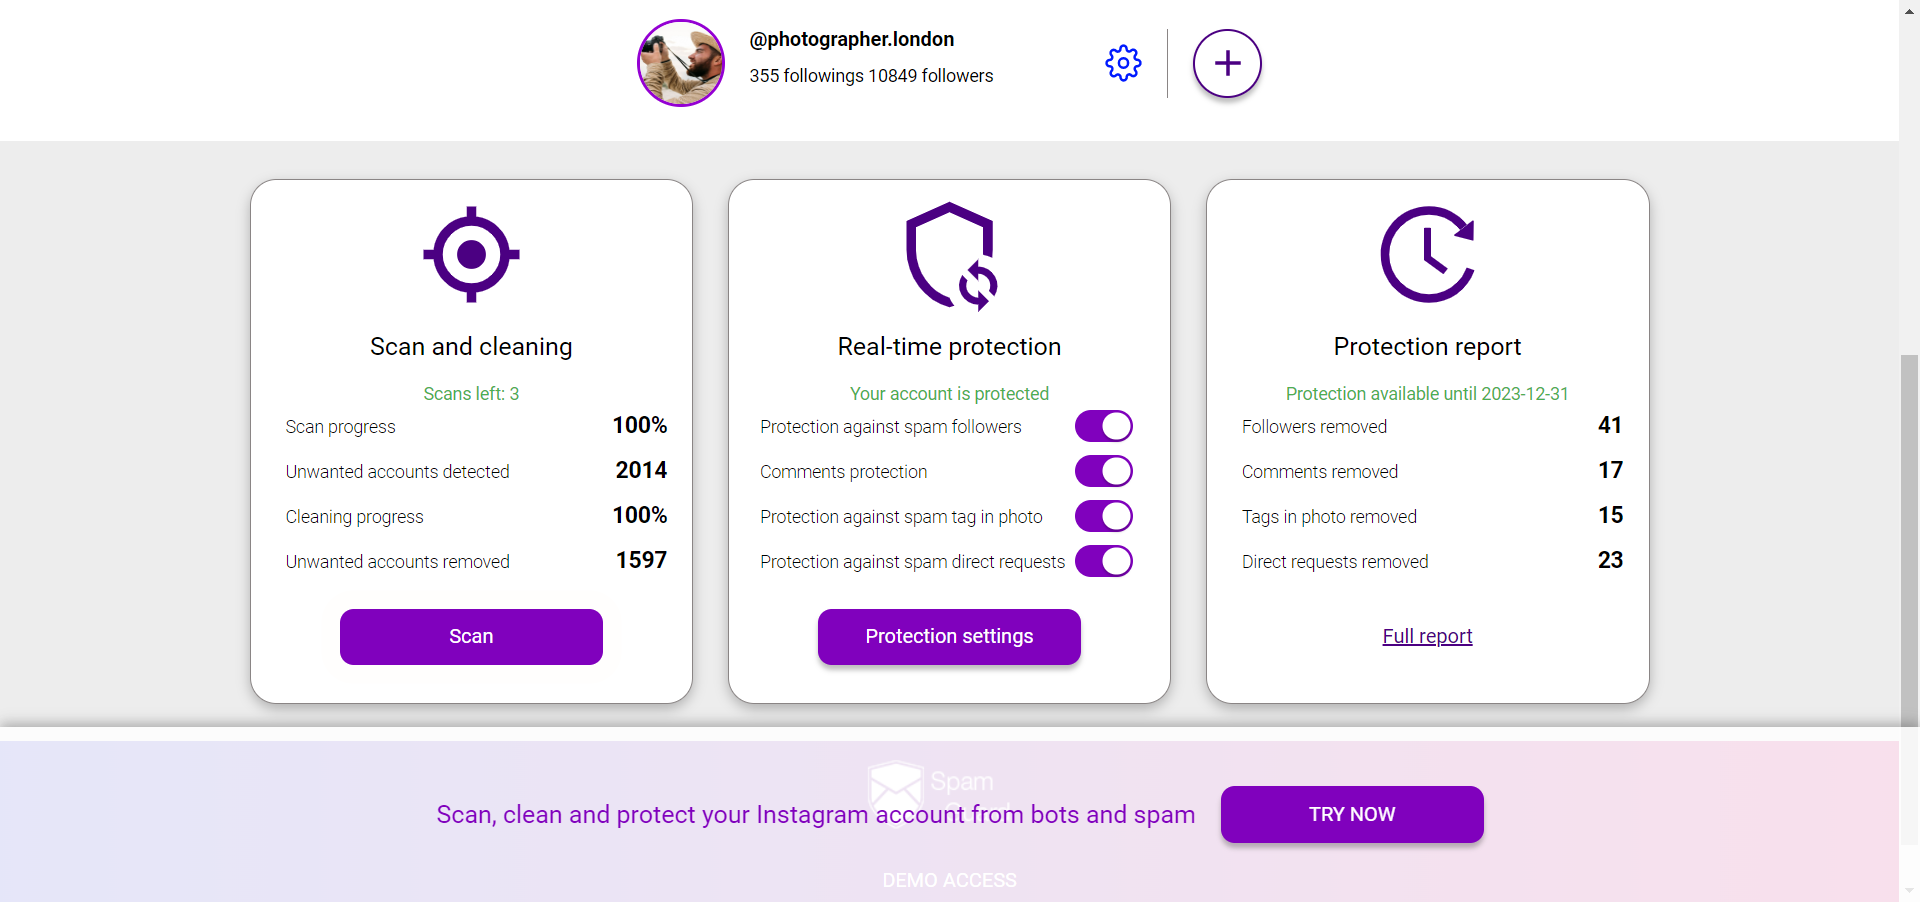
A follower audit with SpamGuard breaks down your audience into: active accounts, inactive accounts (no activity in 6+ months), bots, and fake/commercial accounts. The output is a percentage breakdown that gives you a baseline.
Why this matters for analytics: if 30% of your followers are inactive or fake, your reach rate and engagement rate look artificially low. You might be creating excellent content that performs well with your real audience, but the dead weight is suppressing your visible metrics.
Run a follower audit before drawing conclusions from engagement data — especially before making decisions about changing your content strategy based on low metrics.
Stories Completion Rate
Stories completion rate = (viewers of last frame) ÷ (viewers of first frame) × 100.
This metric tells you whether people watch through your Stories or exit partway. A completion rate above 70% indicates strong Stories content. Below 50% suggests viewers are dropping off — either due to length, format, or relevance.
Completion rate by Stories position: the first frame always has the highest viewership. Track the drop-off curve to find where you're losing people.
Profile Visit to Follow Rate
Found in Instagram Insights: profile visits vs. new followers in the same period.
This ratio tells you how compelling your profile page is. If you're getting 500 profile visits but only 20 new follows, something about your bio, grid, or highlights is not converting. If you're getting 200 visits and 40 follows, your profile is working well.
Optimize this metric through your bio (clear value proposition, who it's for), your pinned posts or highlights, and your grid's first impression.
What to Track Weekly vs. Monthly
Weekly: reach rate on individual posts, ERR, save rate, Stories completion rate. These change quickly and help you iterate on content.
Monthly: follower growth rate, profile visit to follow rate, follower quality audit. These are slower-moving indicators of account health.
Tools: Instagram Insights for output metrics, SpamGuard for follower quality audit. The combination gives you the full picture — what your content is doing and who it's doing it for.