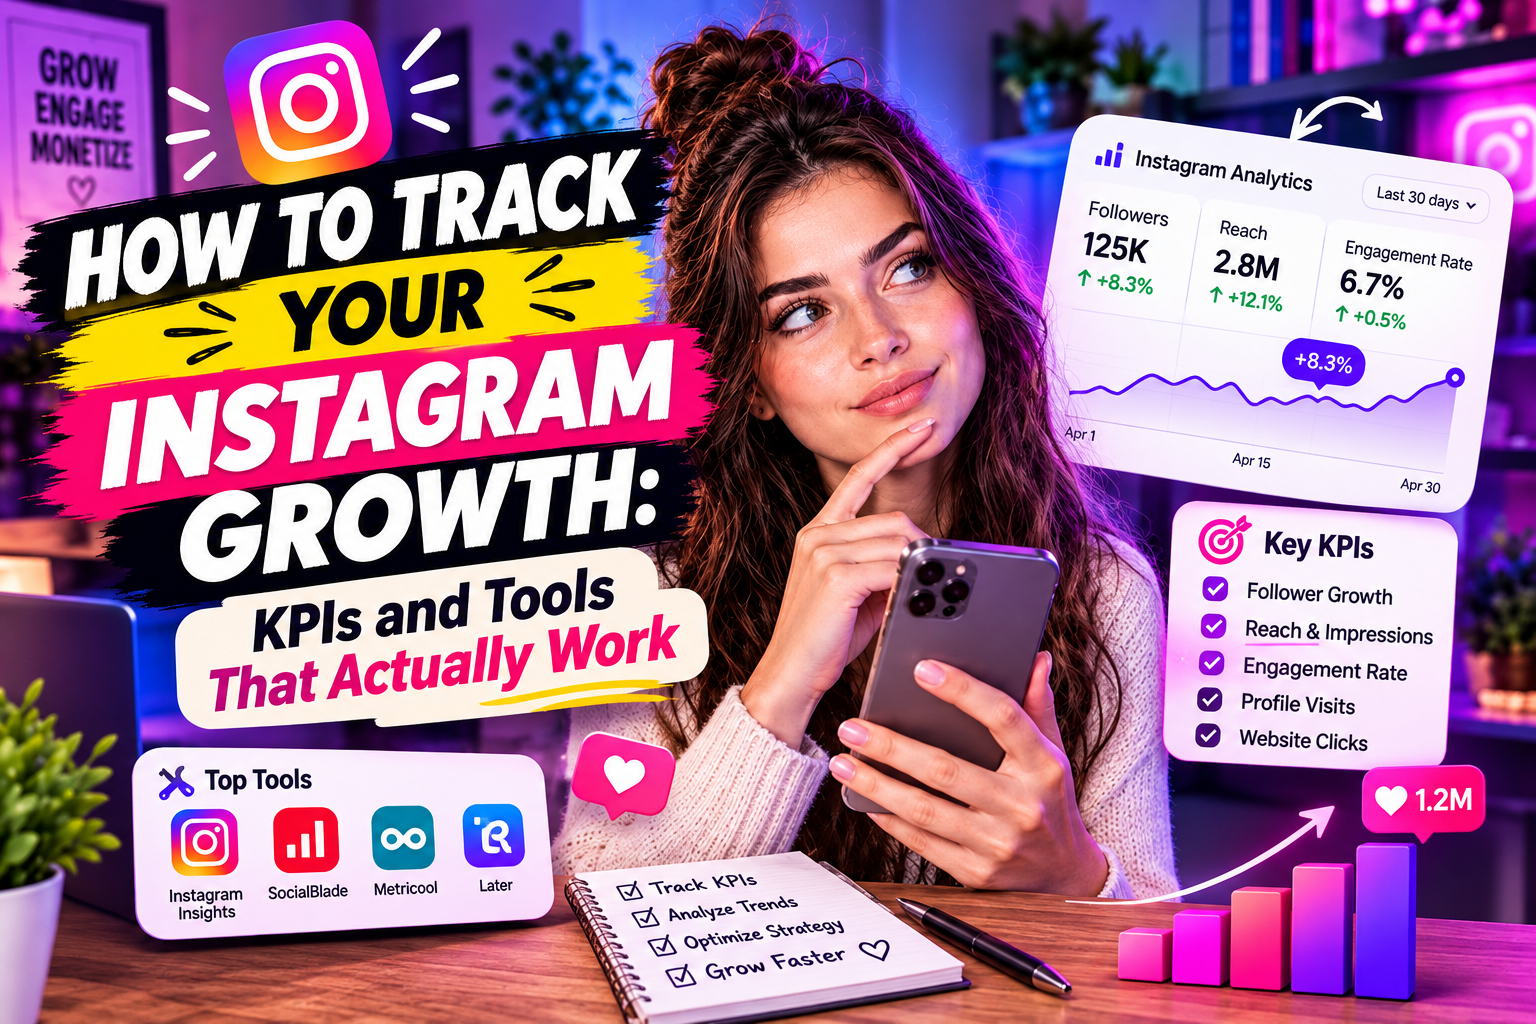
Most Instagram creators track follower count. Some also track likes. These two numbers are the least useful metrics for understanding whether your account is actually growing in a meaningful way. Here's what to track instead, and how to build a measurement system that tells you something actionable.
Why Follower Count Is a Misleading Primary Metric
Follower count is a vanity metric for two reasons. First, it includes everyone who ever followed you, including people who haven't opened Instagram in two years, bots that weren't caught, and accounts that followed for a giveaway and forgot to unfollow. Second, it doesn't tell you whether your content is reaching people or whether those people are doing anything.
An account with 10,000 followers and 2% engagement is weaker algorithmically than an account with 3,000 followers and 8% engagement. Instagram's distribution is proportional to engagement quality, not follower count.
KPI 1: Engagement Rate
Engagement rate = (likes + comments + saves + shares) / reach × 100.
Note: divide by reach, not follower count. Reach-based engagement rate tells you what percentage of people who actually saw your post responded to it. Follower-based engagement rate is distorted by inactive followers and gives a consistently pessimistic number.
Benchmarks vary by account size:
• Under 10K followers: 4–8% is healthy
• 10K–100K followers: 2–4% is healthy
• Over 100K: 1–2% is considered normal
Track this per post and as a 30-day rolling average. A declining 30-day average is an early warning sign before you see it in follower count.
KPI 2: Saves Per Post
Saves are the strongest single engagement signal Instagram uses for content distribution. A save means someone found your content worth returning to — that's a much stronger signal than a like, which costs one tap.
Track saves as an absolute number and as a percentage of reach. If your saves rate is increasing, you're creating content that people find genuinely useful or reference-worthy. If it's declining, your content may be entertaining but not sticky.
KPI 3: Profile Visits to Follows Conversion
Profile visits to follows = new followers / profile visits × 100.
This tells you how well your profile converts curious visitors into followers. If you're getting many profile visits (from Reels, comments, hashtags) but few conversions, the problem is your profile itself — bio, highlights, pinned posts — not your content reach.
A healthy conversion rate is roughly 10–20%. Lower means your profile isn't giving visitors a clear reason to follow.
KPI 4: Reach Rate
Reach rate = post reach / followers × 100.
This tells you what percentage of your followers are actually seeing your posts. For most accounts, this is 10–30%. If your reach rate is below 10%, the algorithm is significantly suppressing your content's distribution. If it's above 30%, you're in good standing.
Reach rate is the clearest signal of your relationship with the algorithm. Track it per post type — Reels, carousels, single images — to understand which formats get better distribution.
KPI 5: Follower Quality
Not all followers are equal. An account with 20% bot followers has artificially inflated follower count and suppressed engagement rate — the bots don't engage. This creates a negative feedback loop: low engagement leads to lower algorithmic distribution, which makes it harder to reach real people.
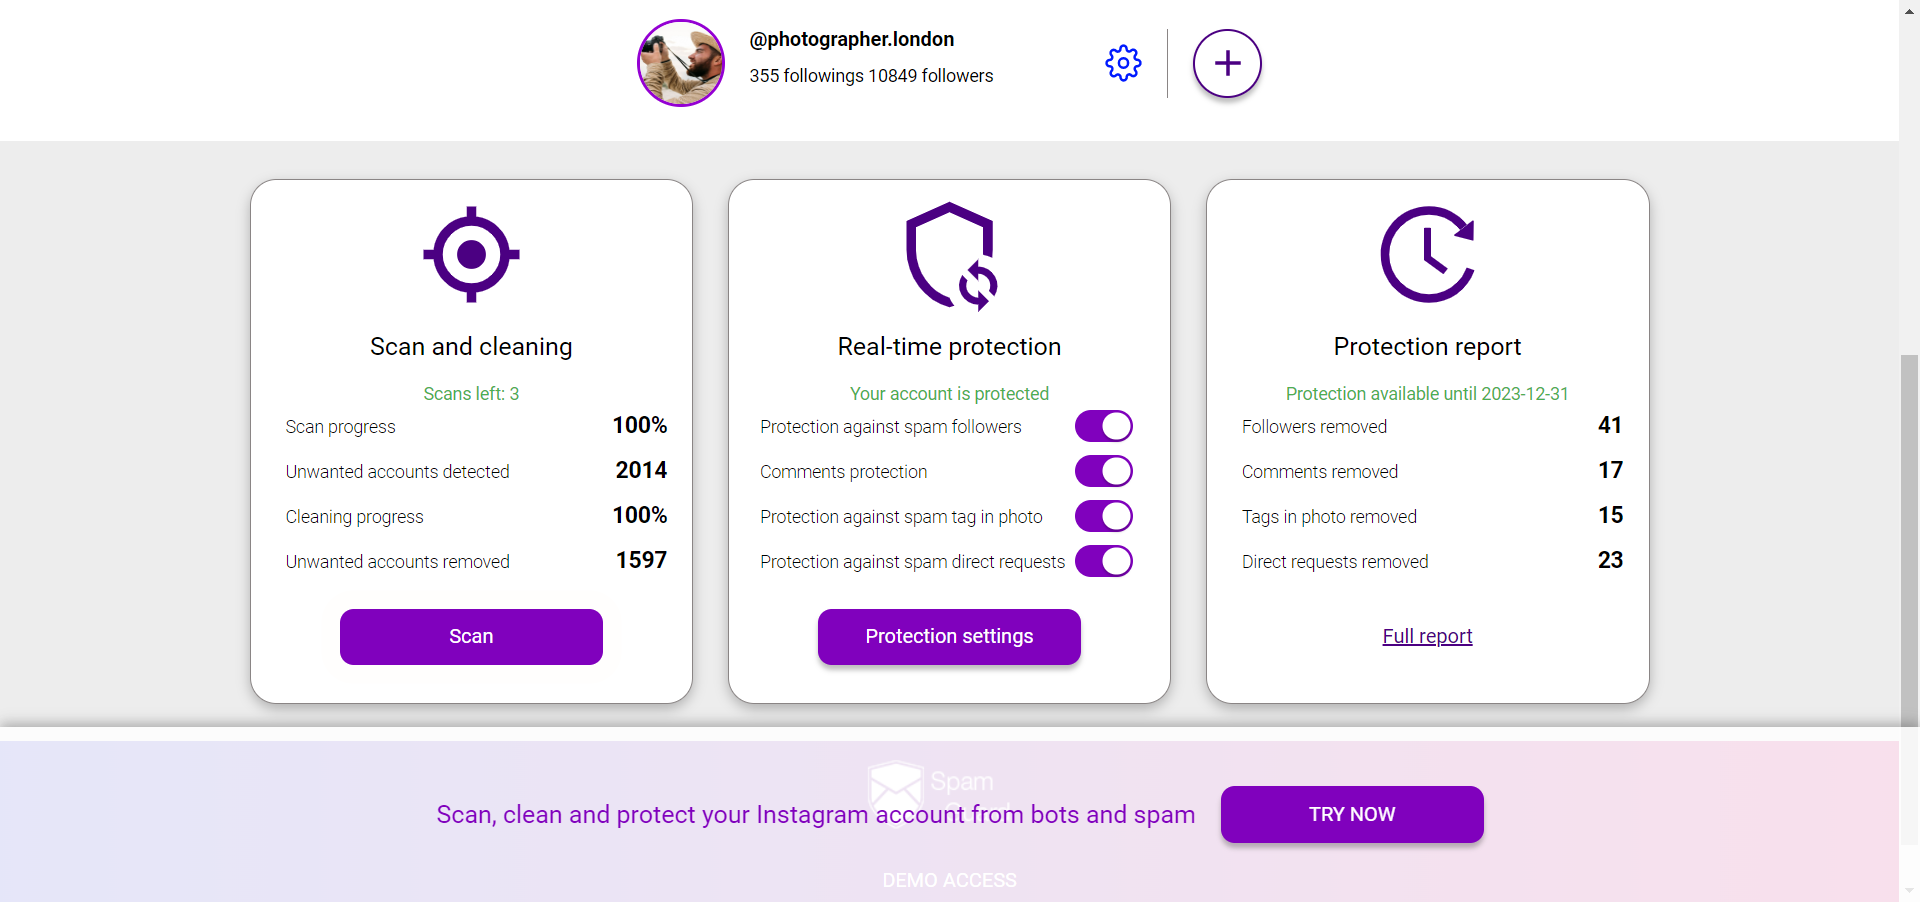
Regularly audit your follower base with SpamGuard. Removing fake followers improves your engagement rate, which improves algorithmic distribution, which grows real audience faster. This is a maintenance task, not a one-time action — bots accumulate continuously on active accounts.
Building a Weekly Tracking System
A simple system: every Monday, record these numbers in a spreadsheet:
1. Follower count (and change from last week)
2. Average engagement rate for posts published last week
3. Average saves rate for posts published last week
4. Best-performing post: reach, engagement, saves
5. Profile visits and follows conversion rate
Review the 4-week trend, not just week-over-week. Single-week fluctuations are noise. Four-week trends are signal. When a metric has been declining for three consecutive weeks, that warrants a content or strategy change.